Artificial intelligence & data engineering
Chronicle
Research the evidence. Reconstruct the story.
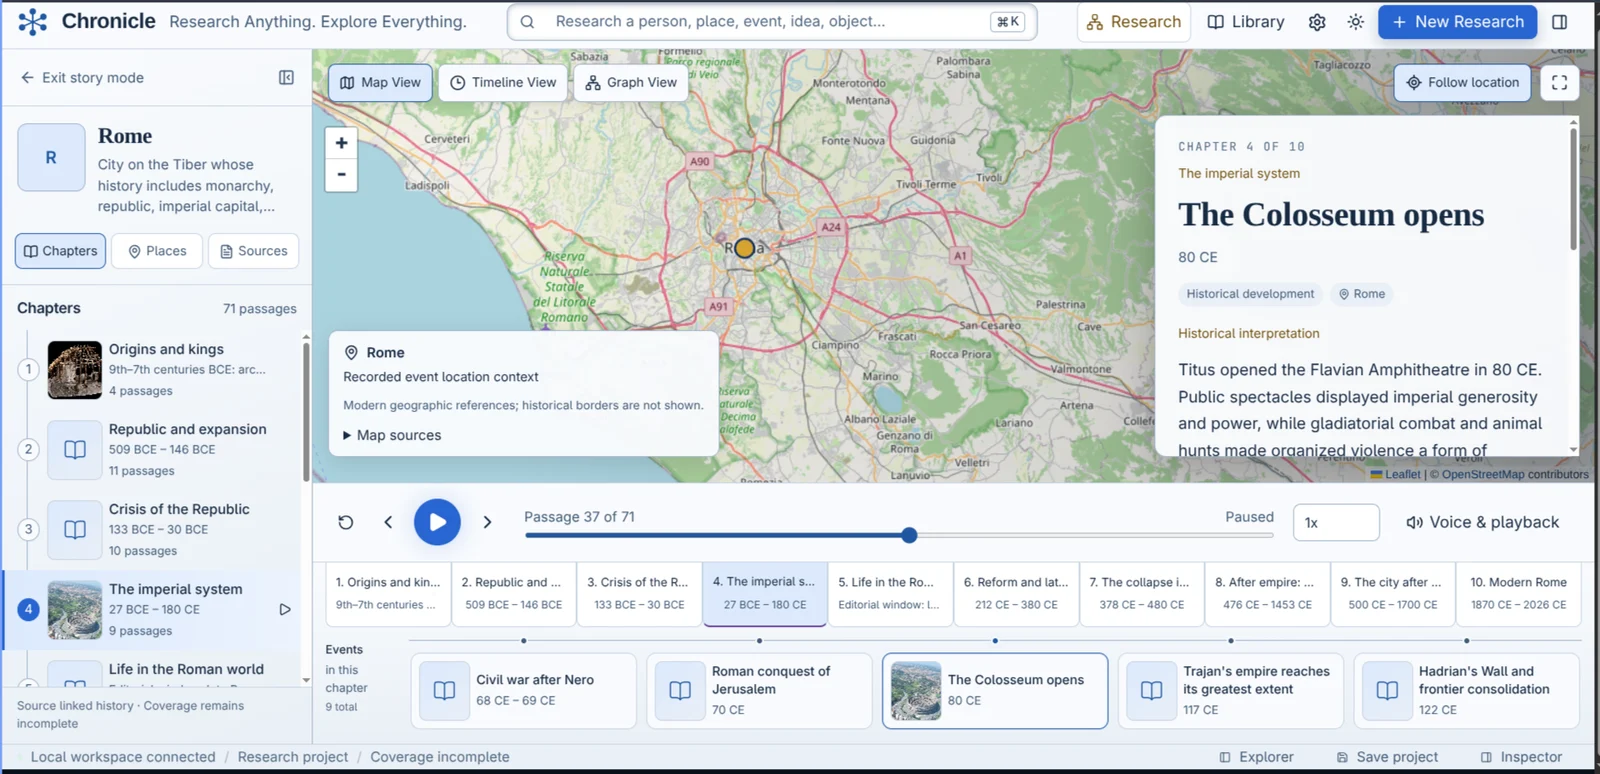
Rome in Story mode. Original Chronicle interface capture. Map data © OpenStreetMap contributors. OpenStreetMap attribution
The overview
A local academic research workspace that investigates subjects and builds source-backed timelines, relationships, maps, and narrated stories.
The problem
Turn scattered historical sources into an explorable account while keeping the underlying evidence, uncertainty, and gaps available for inspection.
How it fits together
A Go backend and TypeScript web interface coordinate research with configured AI models and MCP search/retrieval tools. Source passages inform chronological records, connected graph views, and geographic story playback.
- Sources + models
- Research records
- Graph / map / story
Implementation highlights
-
Research planning, source retrieval, and inspectable supporting passages.
-
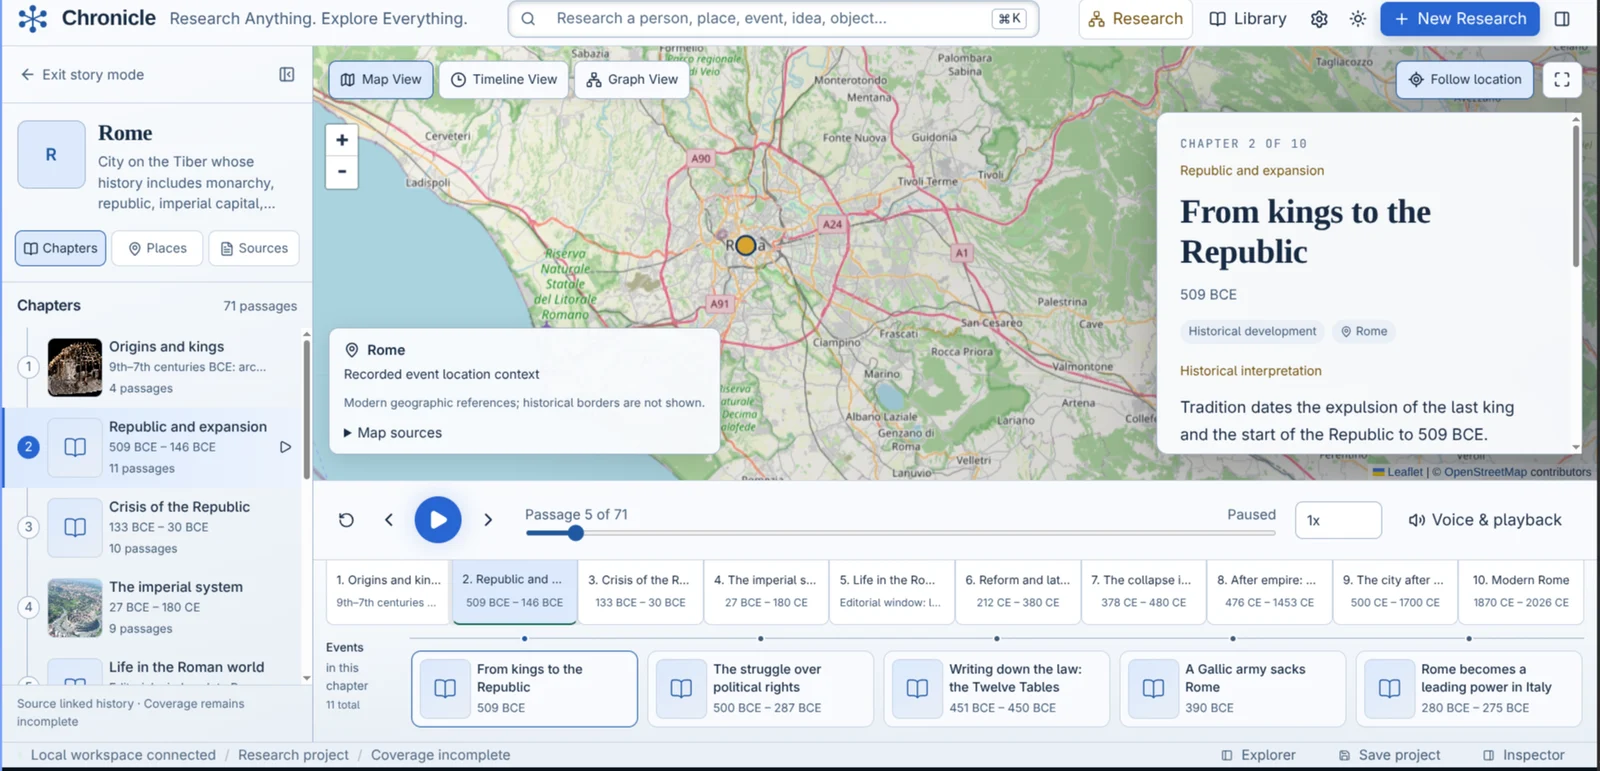
Linked timeline, graph, map, and story views share the selected event.
-
Narrated playback follows recorded places; projects can be annotated, imported, and exported.
Engineering considerations
The system preserves competing claims, uncertain dates, and coverage gaps. Representative map points and modern basemaps are not reconstructions of historical borders.